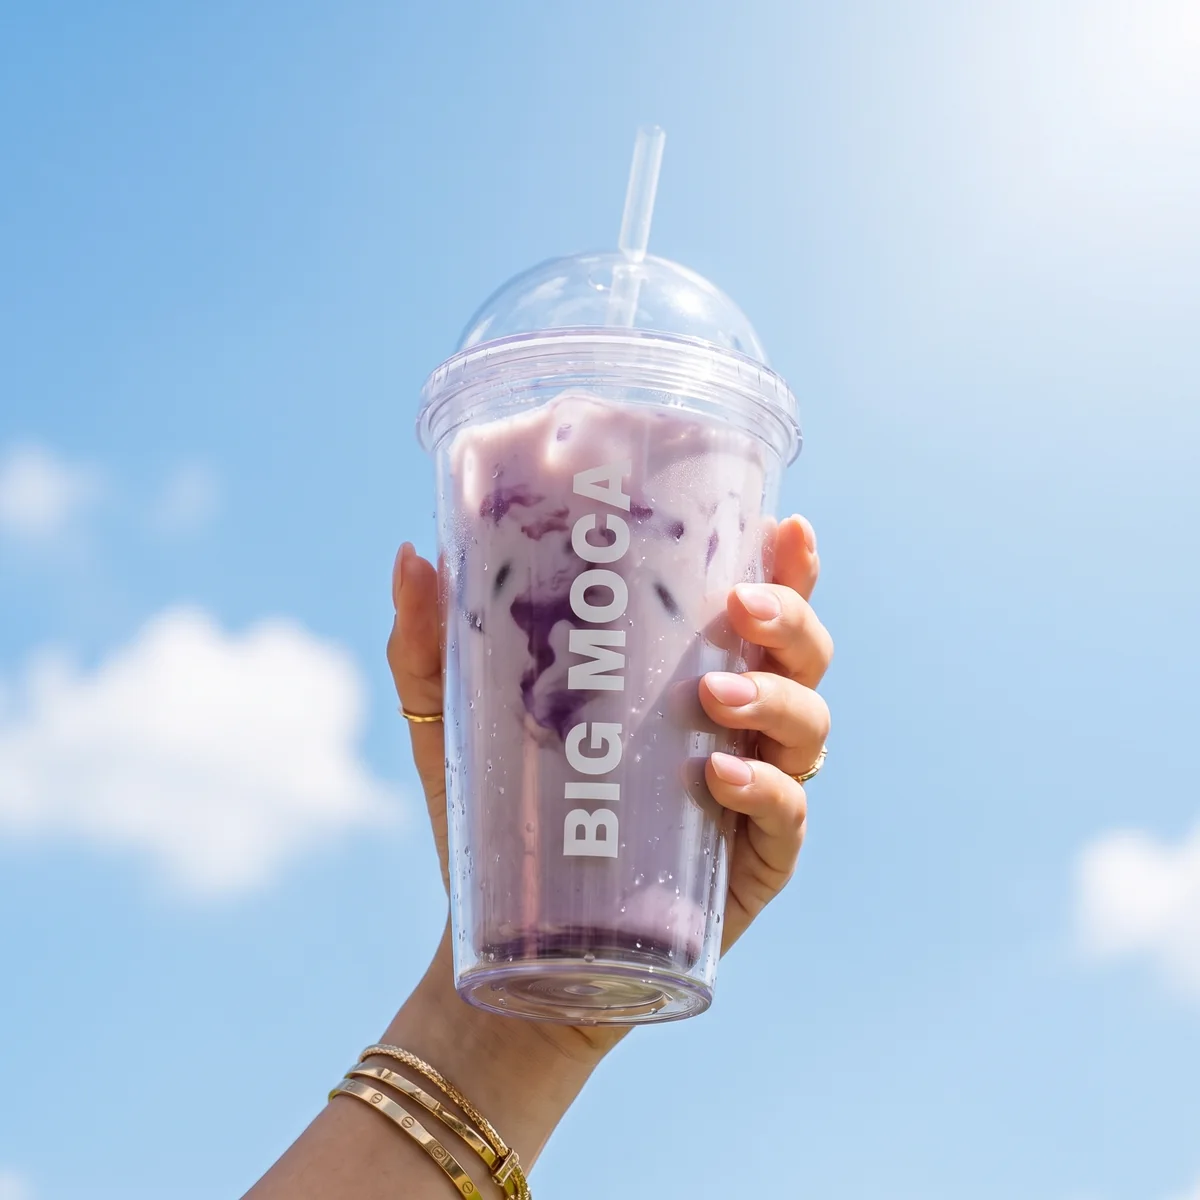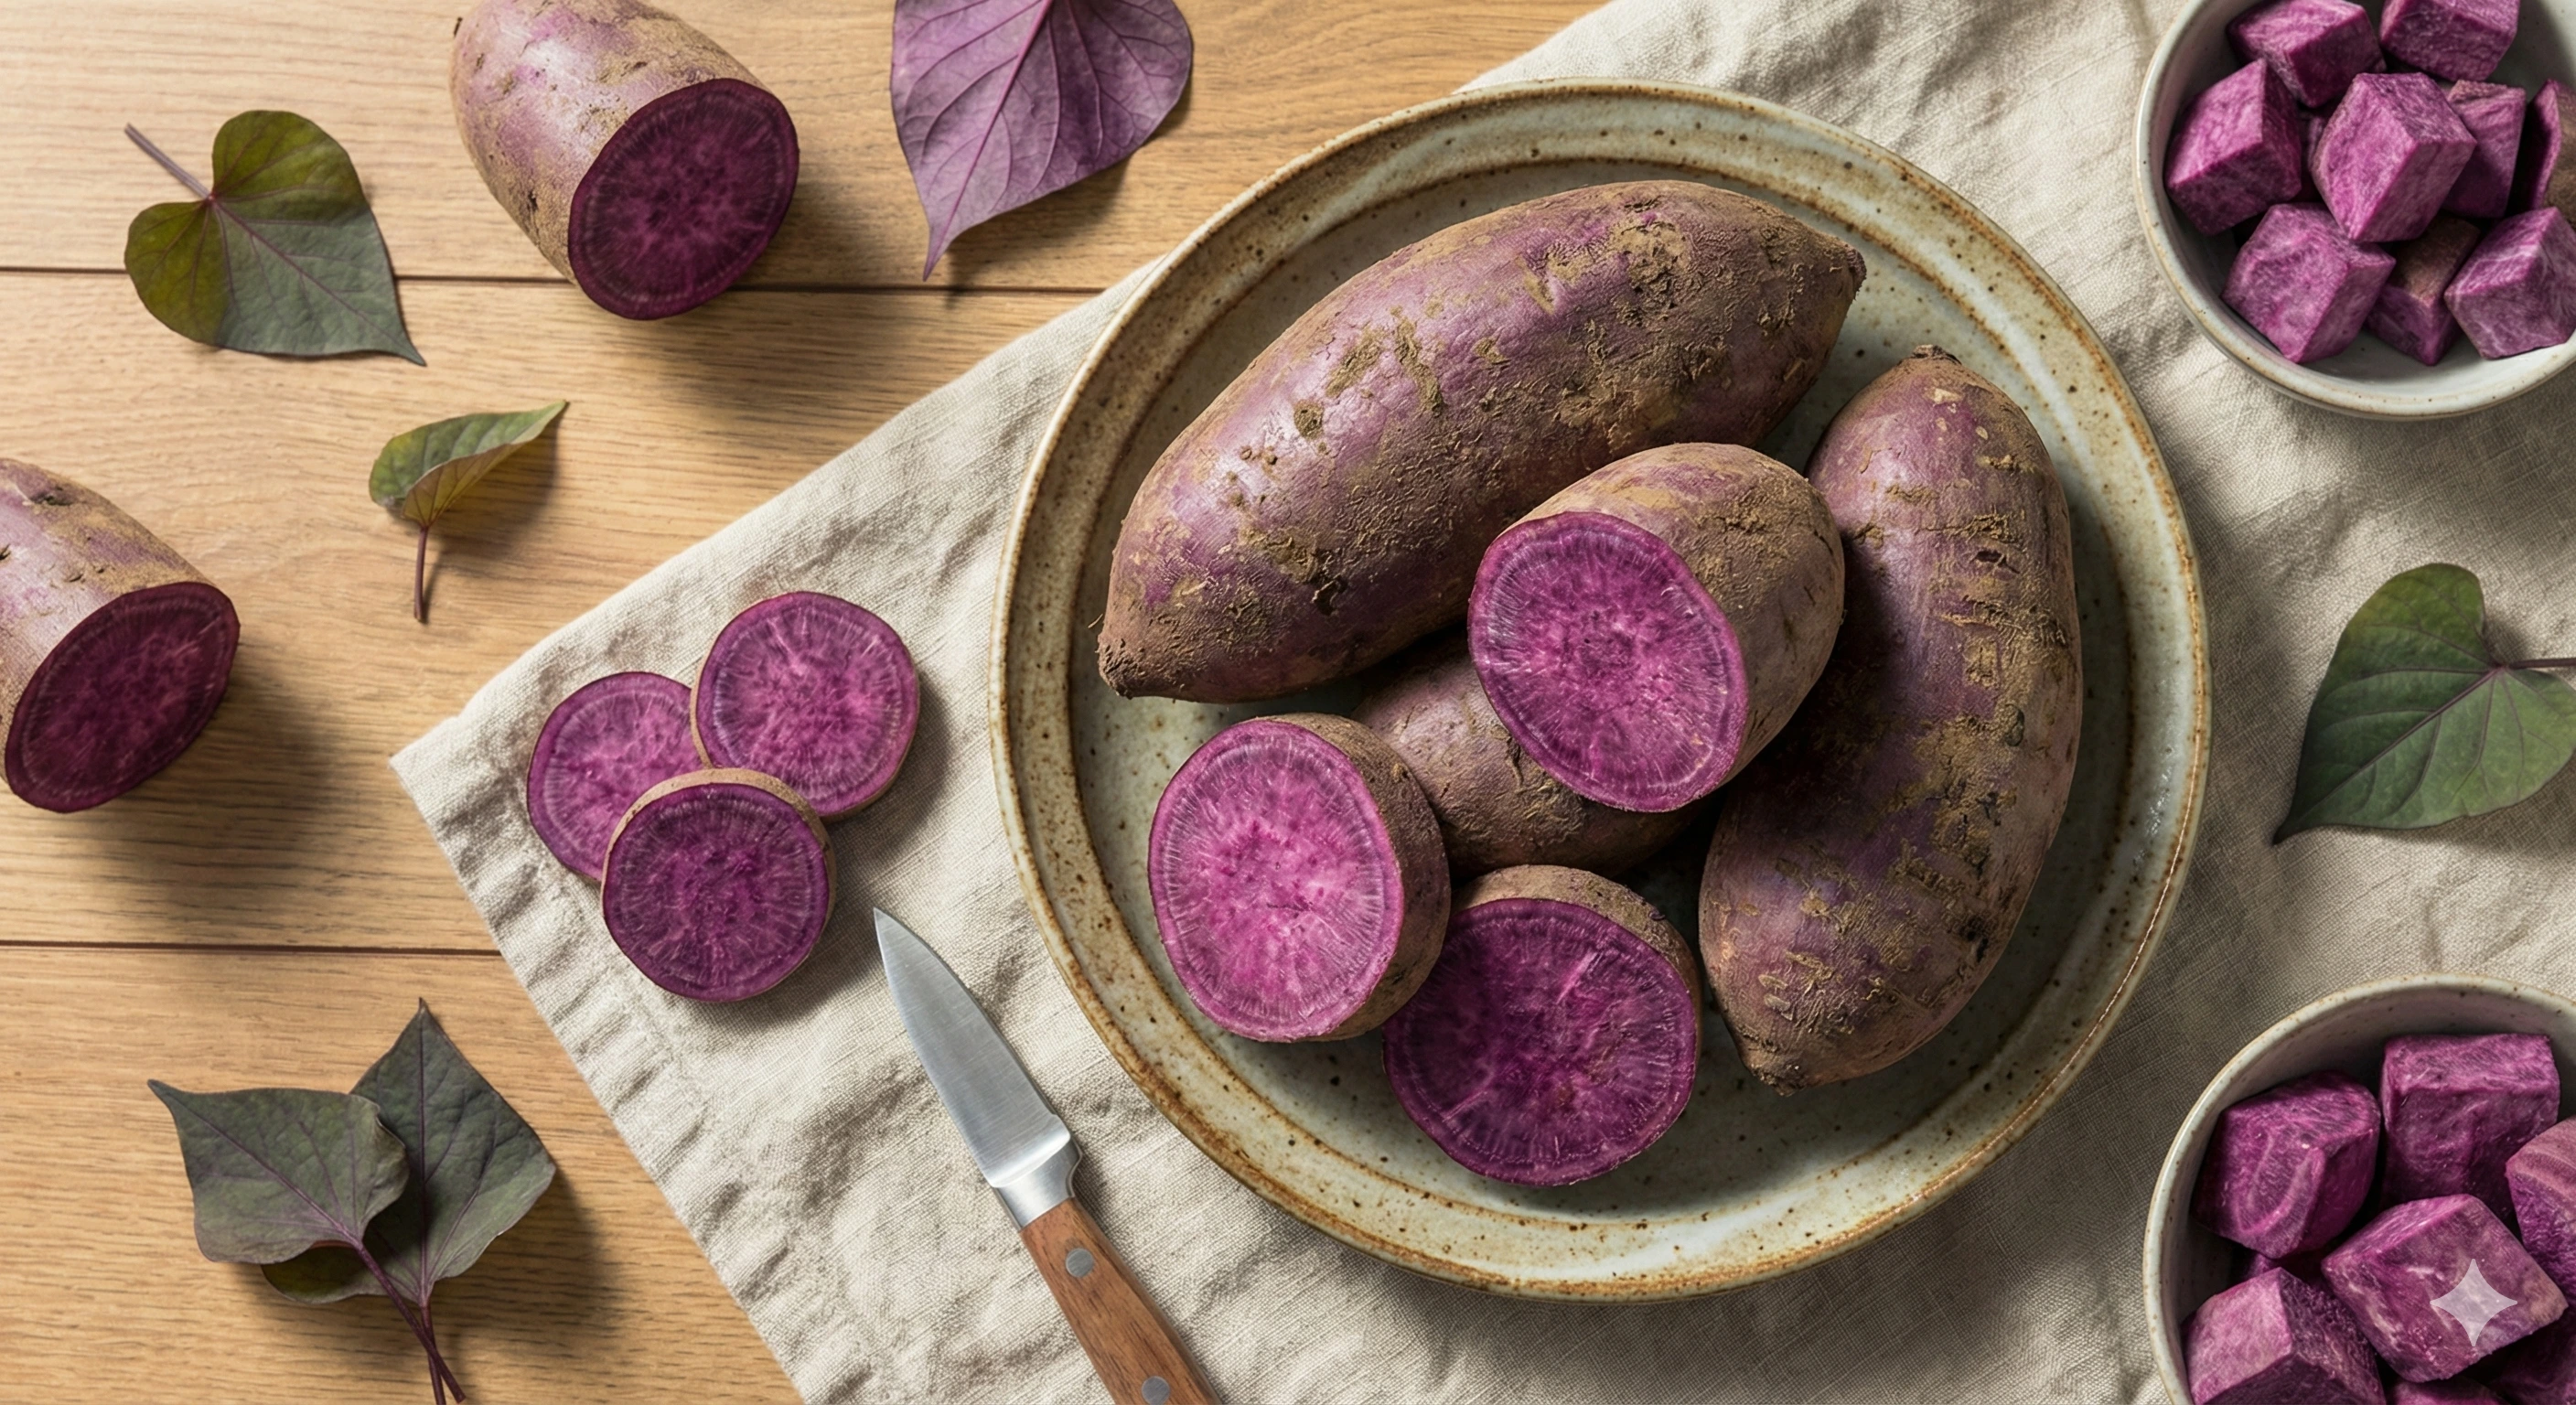
Search interest (Google Trends)
We retrieve the figures from trends.google.com, category "All categories", web search, 1 January 2022 to 31 October 2026. For that period Google returns weekly values, which we average per month.
A value from 0 to 100 is ube's share of all searches in that country, where 100 is the highest point in the same comparison. Growth is the January–October 2026 average divided by the same average in 2025, so we compare the same months.
We track the search term "ube", the topic "Purple yam" and, per country, "ube latte" and the word for powder in the local language. In France "UBE" is also the abbreviation of the Université Bourgogne Europe in Dijon, so there we use the topic instead of the search term.
Google Trends works with a sample. A new request can shift values by a few points. A 0 means too little data, not that nobody searches.
Ube on the menu
For each city we use the same searches in Google Maps ("ube", "ube latte", "ube cake" and "Filipino bakery" with the city name) and on the web, also in the local language. In total that was 16 Maps and 11 web searches.
A venue counts as confirmed when its own menu, its own website or an article from 2025 or 2026 names the ube item. Likely means the evidence is older or indirect. Everything else is listed as uncertain and does not count. Delivery sites such as Deliveroo and Uber Eats blocked our access, so we don't use them as evidence for now.
Without an account, Google Maps only shows a limited number of results, so the count is a lower bound. We repeat it every quarter with the same searches and mainly compare with the same month a year earlier, because ube drinks and ice cream appear on menus more often in summer.
Our own sales
We read our sales from Shopify (read-only) and only publish indexes and percentages, never amounts or units. Ube products are all products with ube in the name. Sample pouches are excluded. Sales via bol.com, Amazon and Ankorstore are not in Shopify and so are not included.
Our current web shop started on 15 January 2026, so the first full quarter, April to June 2026, is the base (= 100). Because new pack sizes were added in 2026, we show revenue and kilos separately.
Errors and corrections
Spotted an error, or is your venue or product listed wrongly in the data? Email info@yoghoyogho.nl with a link to your source. We check it within two weeks, update the data and list the change below.
Changes
- 2 November 2026: first edition, State of Ube 2026.
Downloads
All files are UTF-8 with a dot as decimal separator. The licence is CC BY 4.0.
- Search interest by month and country, 2022–2026 (CSV)
zoekinteresse-maandelijks.csv - Search interest: yearly averages and index (CSV)
zoekinteresse-index.csv - Ube on the menu, four cities (CSV)
menukaart.csv - Big Moca sales index 2026 (CSV)
big-moca-index.csv - Everything in one file (JSON)
ube-index-2026.json
How to cite the figures
Source: Big Moca Ube Index, "State of Ube 2026", November 2026, https://www.bigmoca.nl/en/ube-index